|
|


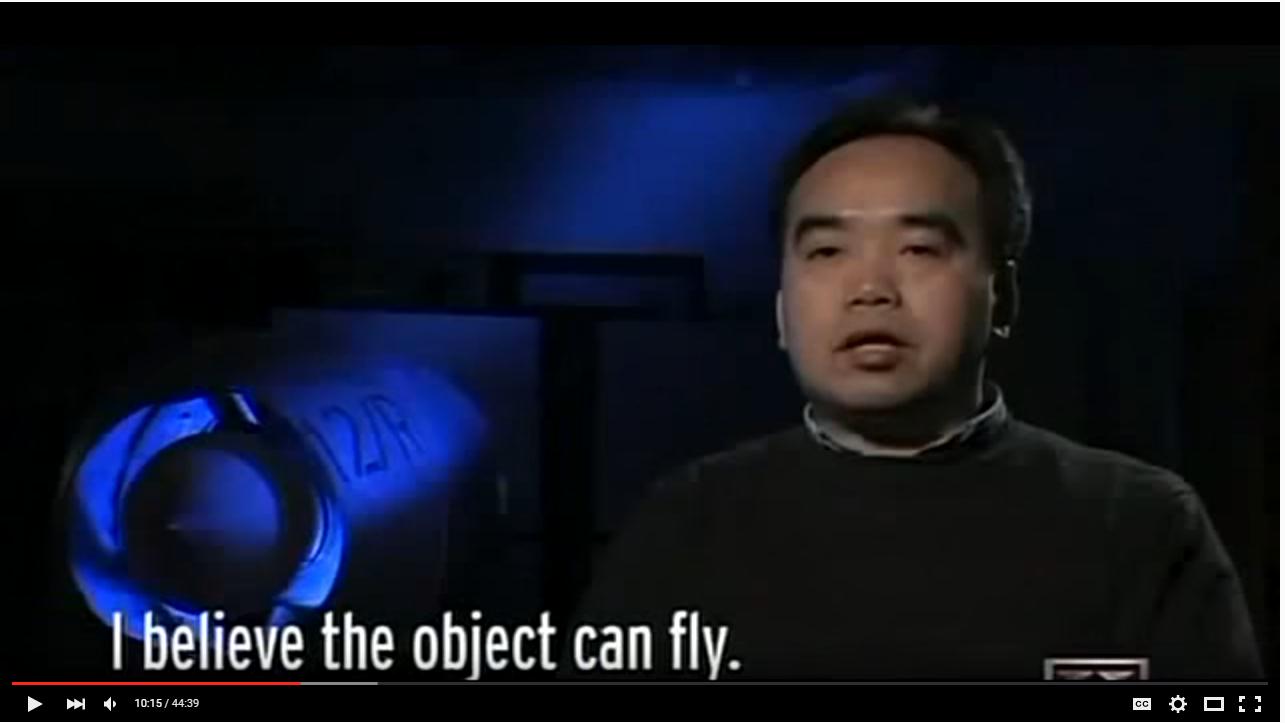
A Collection of Videos related to our Laboratory
 |
 |
 |
Gallery of Flow Visualization Photos and Animations
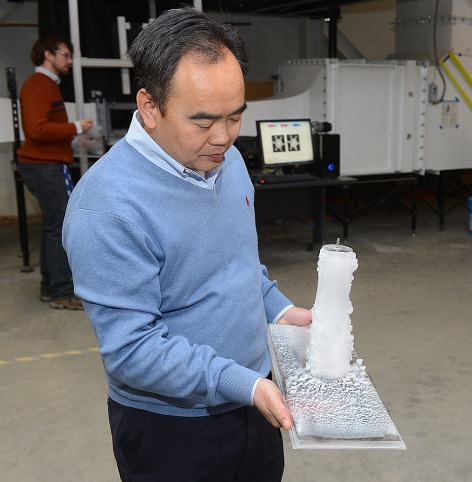
icing tunnel testing of dynamic ice accreting process over a cylindrical test model

(a). airflow velocity V=15m/s (b). airflow velocity V=20m/s (c). airflow velocity V=25m/s
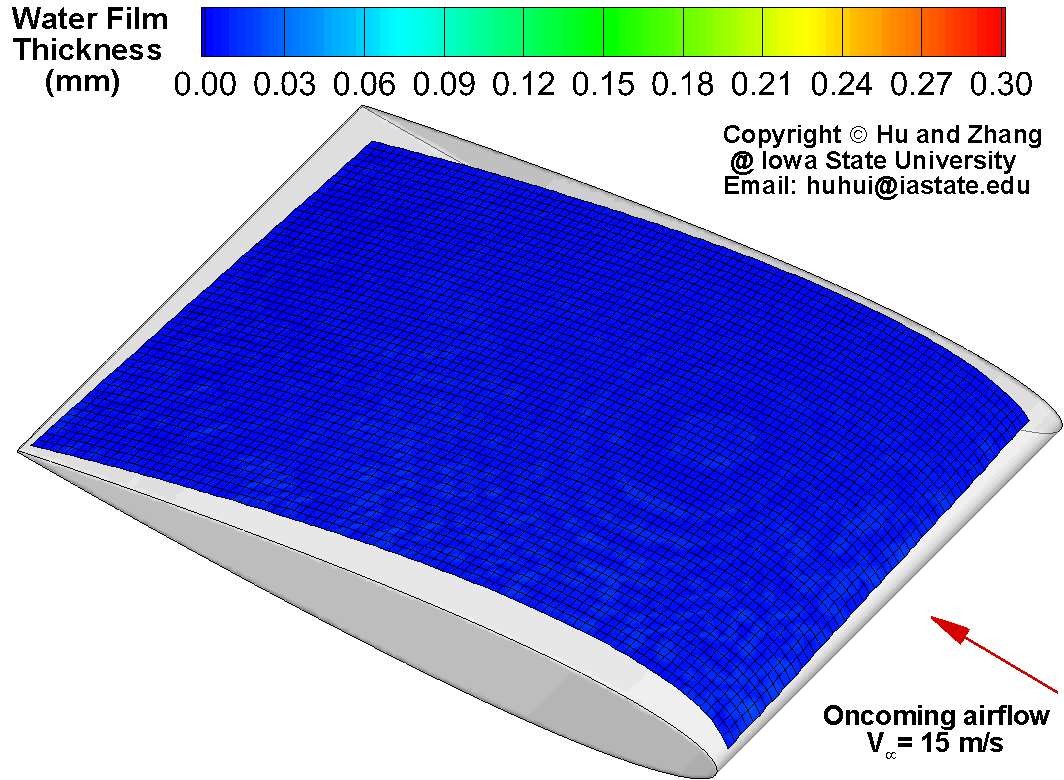
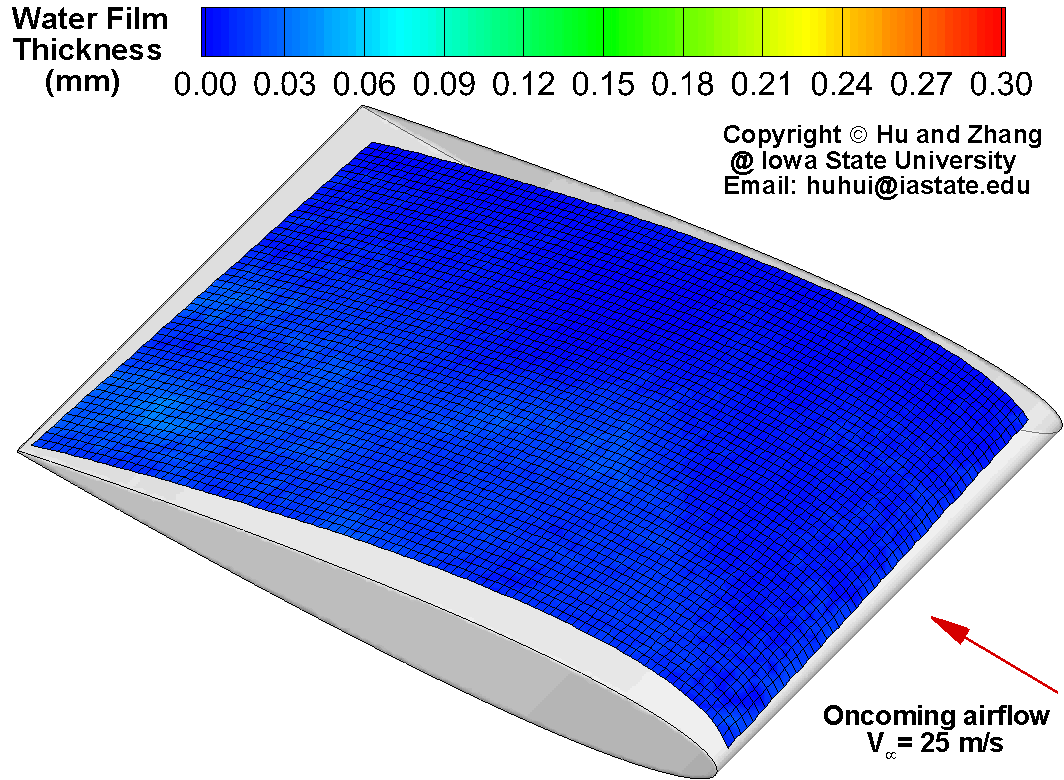
Surface water rivulet/film flow over a NACA0012 airfoil pertinent to aircraft icing phenomena (Zhang, Tian and Hu, 2015)
(a). Over the upper surface of the airfoil
(b). Over the lower surface of the airfoil
Glaze ice accretion process over a NACA0012 airfoil with airflow speed V=35m/s, T=-8°C, α = 5.0 deg. (Waldman & Hu, 2015)
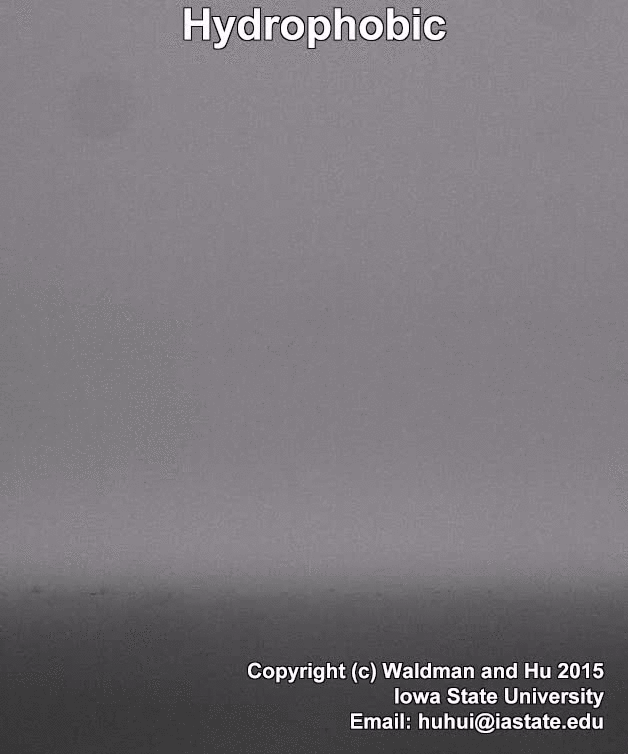
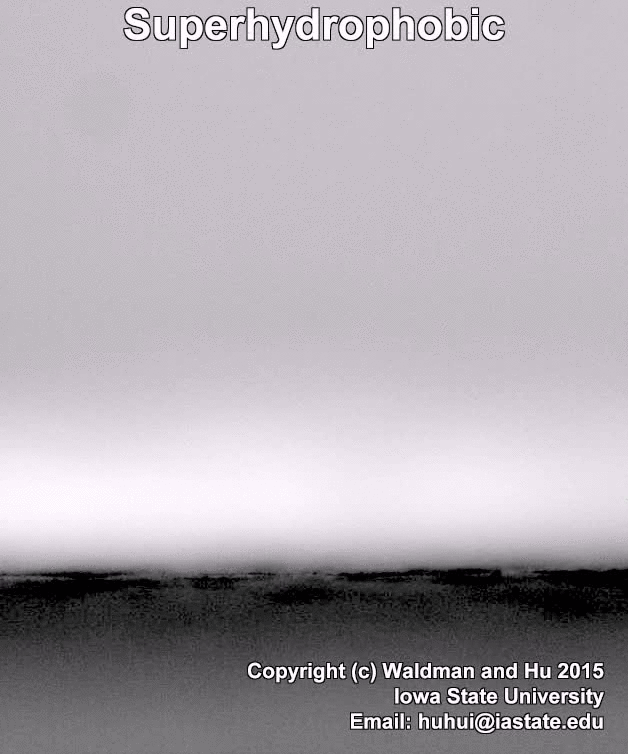
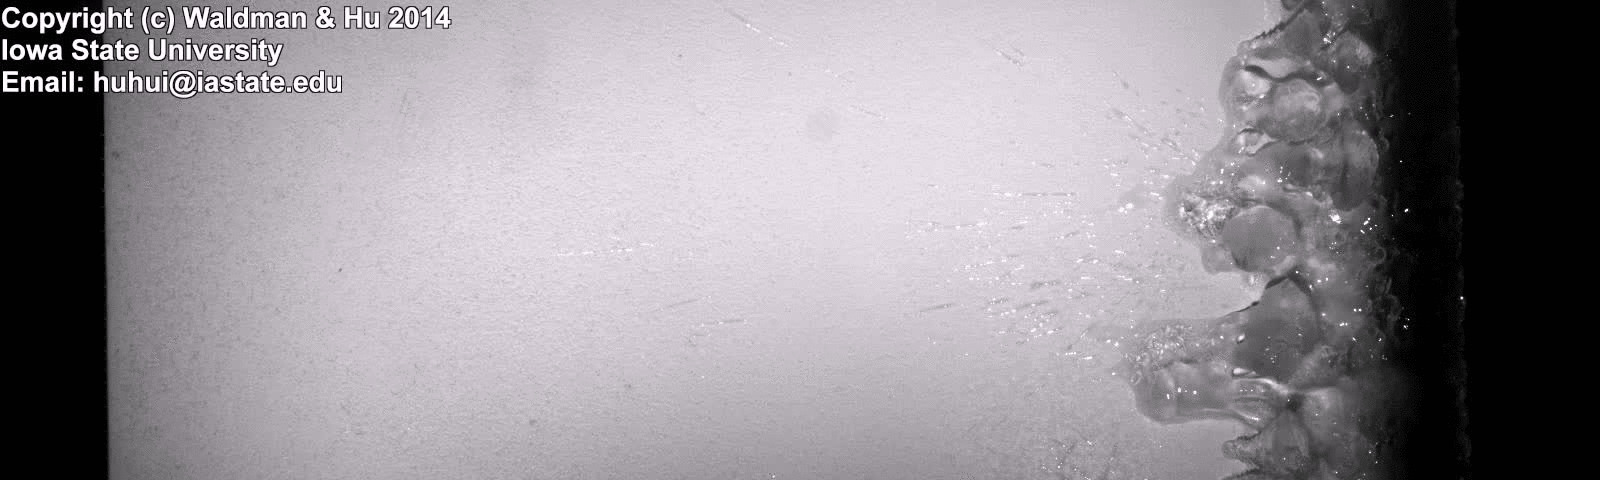
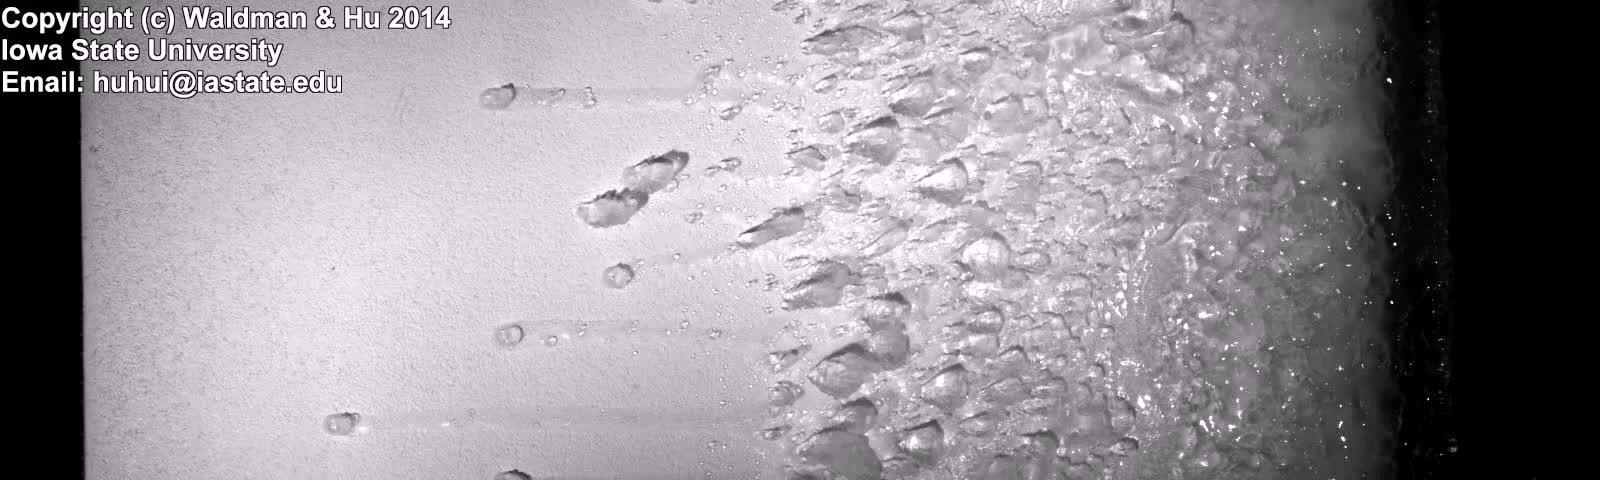
Comparison of water droplet impinging onto a surface with and without superhydrophobic coating (Waldman & Hu, 2014)
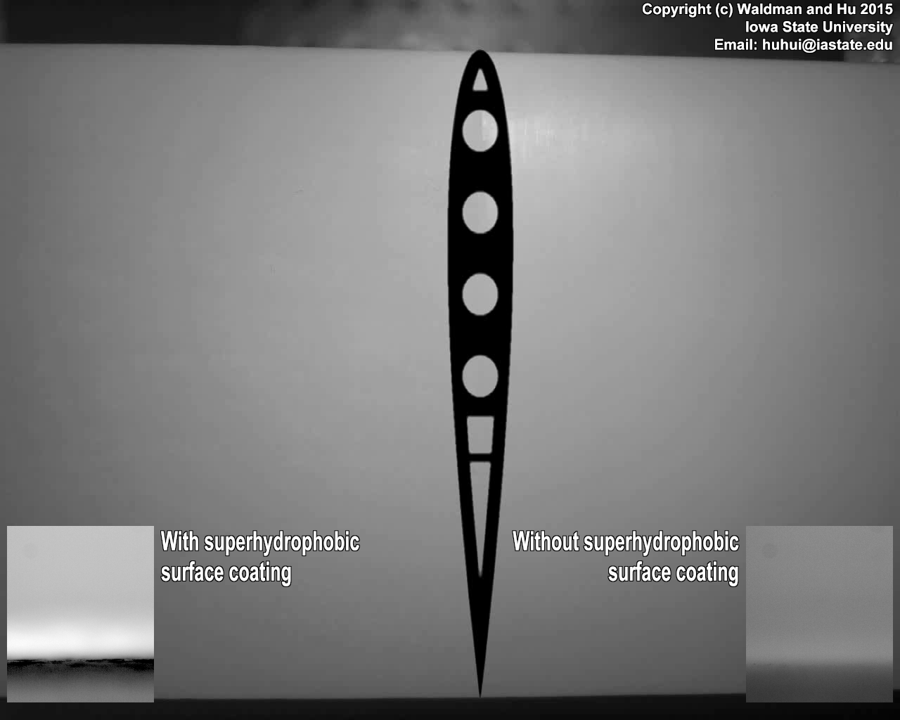
Effects of superhydrophobic surface (SHS) coating on the ice accreting process over an airfoil surface (Waldman & Hu, 2015)
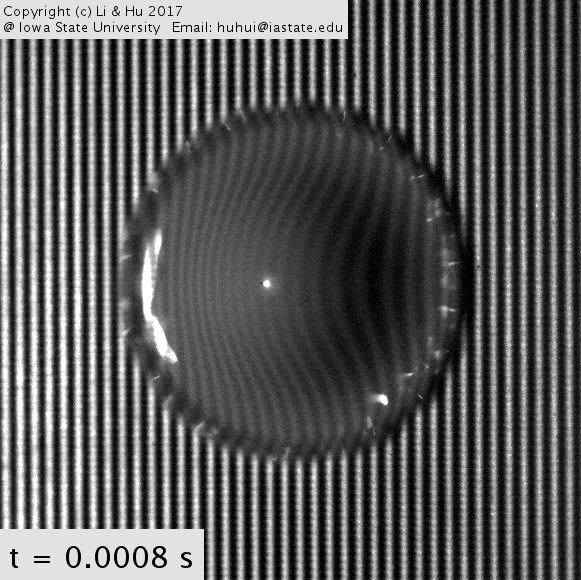
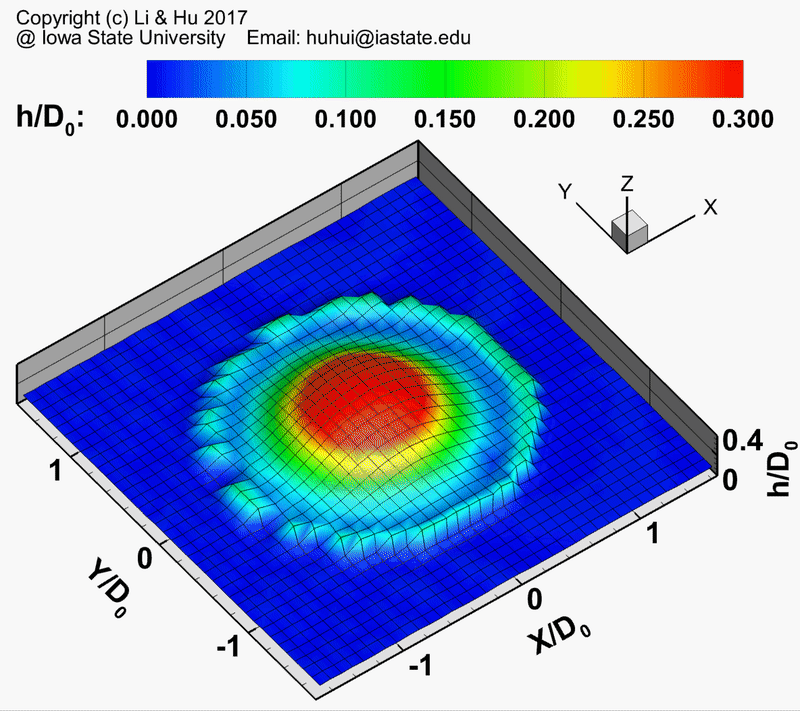
DIP Measurements to reveal the dynamics of droplet impact process (Li & Hu, 2017)
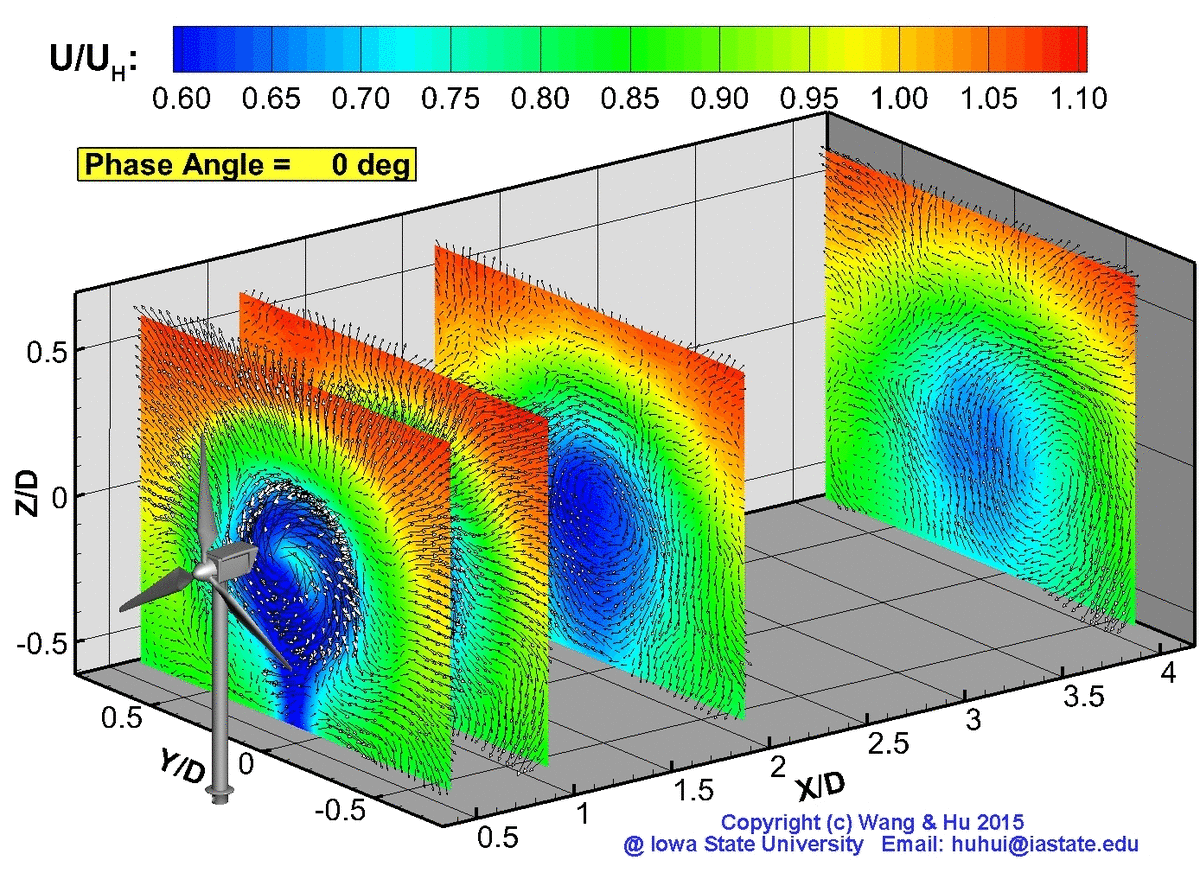
Stereoscopic PIV measurements in the wake behind a wind tubine (Wang, Tian & Hu, 2015)
The wake vortices and turbulent flow structures behind a conventional Single-Rotor Wind Turbine (SRWT)

The wake vortices and turbulent flow structures behind a Co-rotating Dual-Rotor Wind Turbine (Co-DRWT)
The wake vortices and turbulent flow structures behind a Counter-rotating Dual-Rotor Wind Turbine (Counter-DRWT)
(Copyright © Zhenyu Wang, Ahmed Ozbay Wei Tian and Hui Hu @ Iowa State University, 2014)
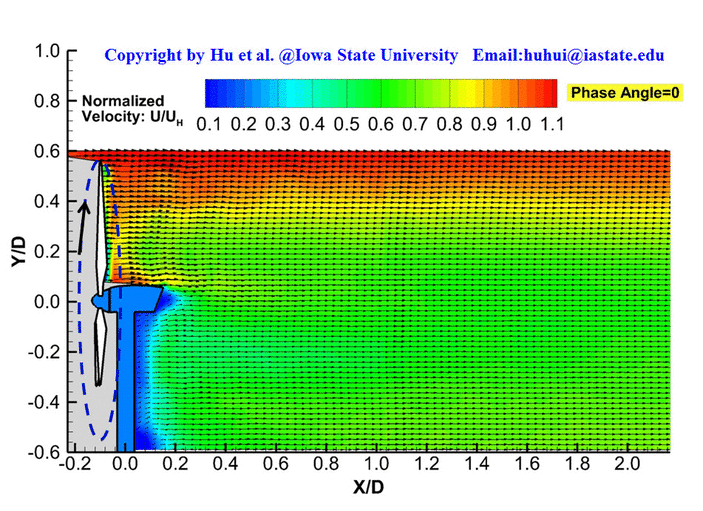
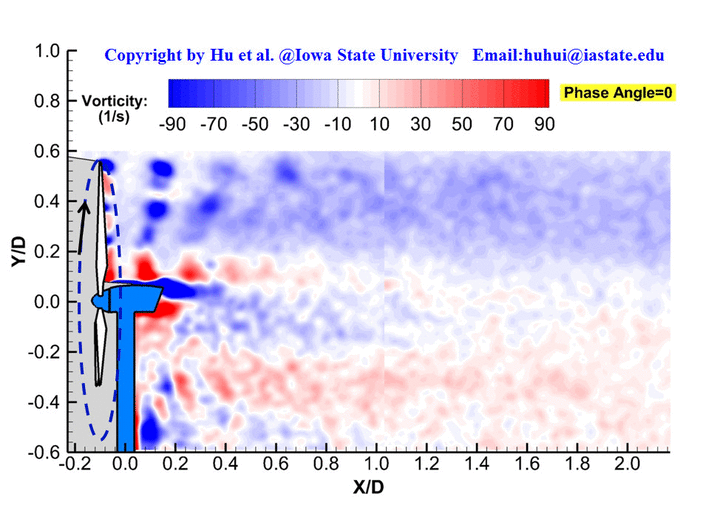
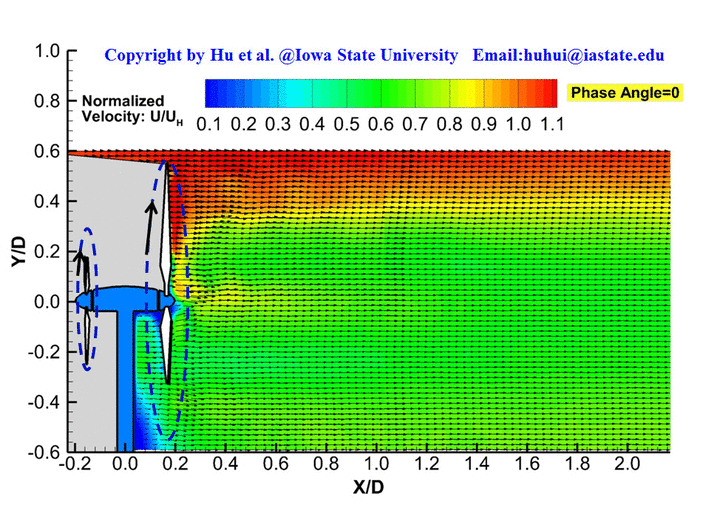
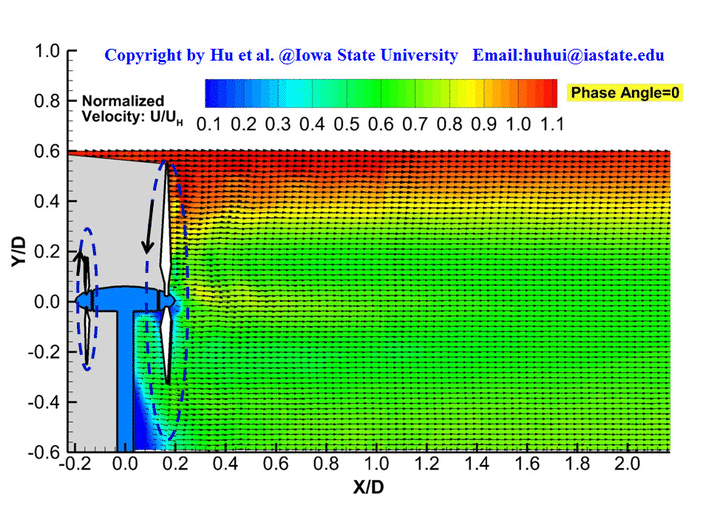
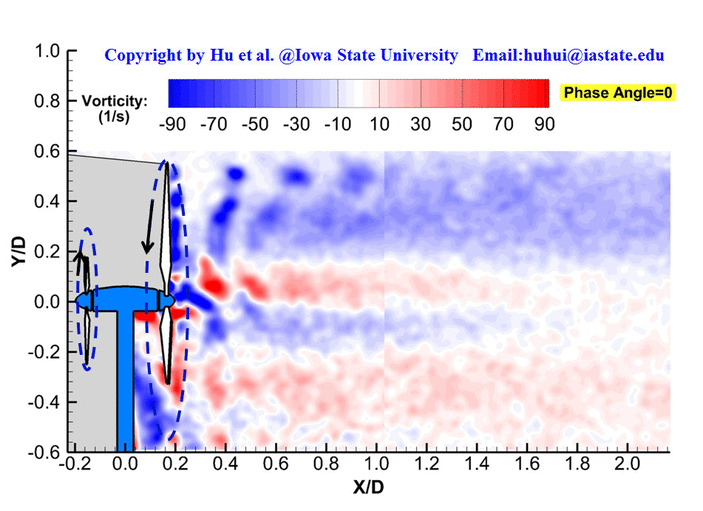
PIV Measurements of Wind Turbine Wake (Hu et al. 2012)
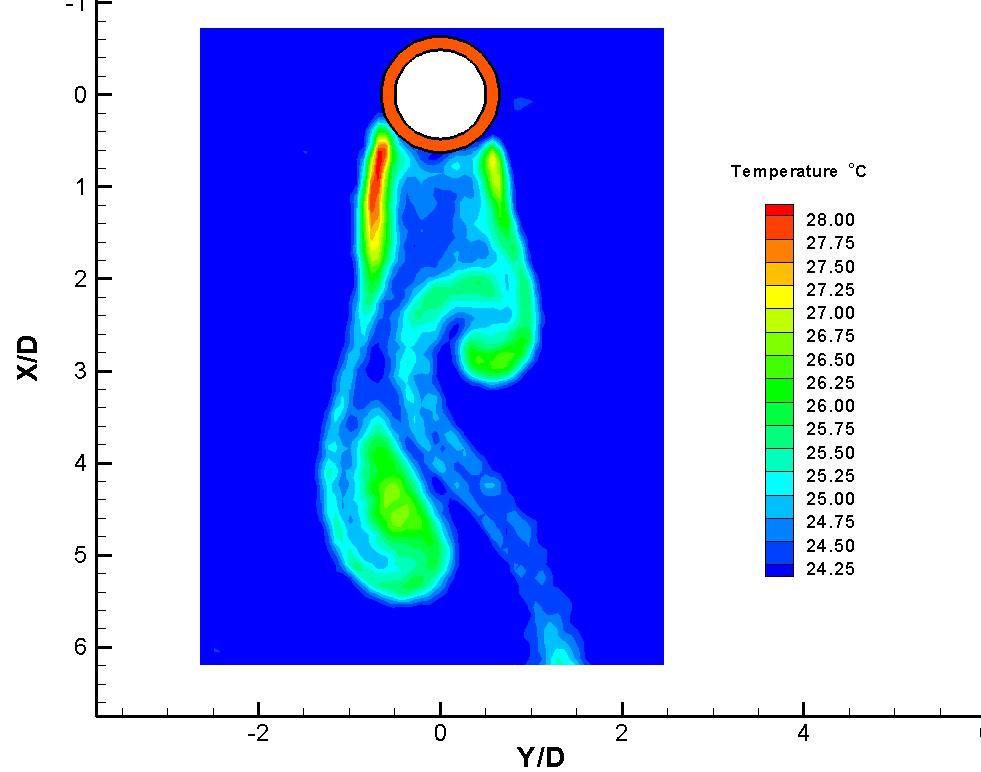
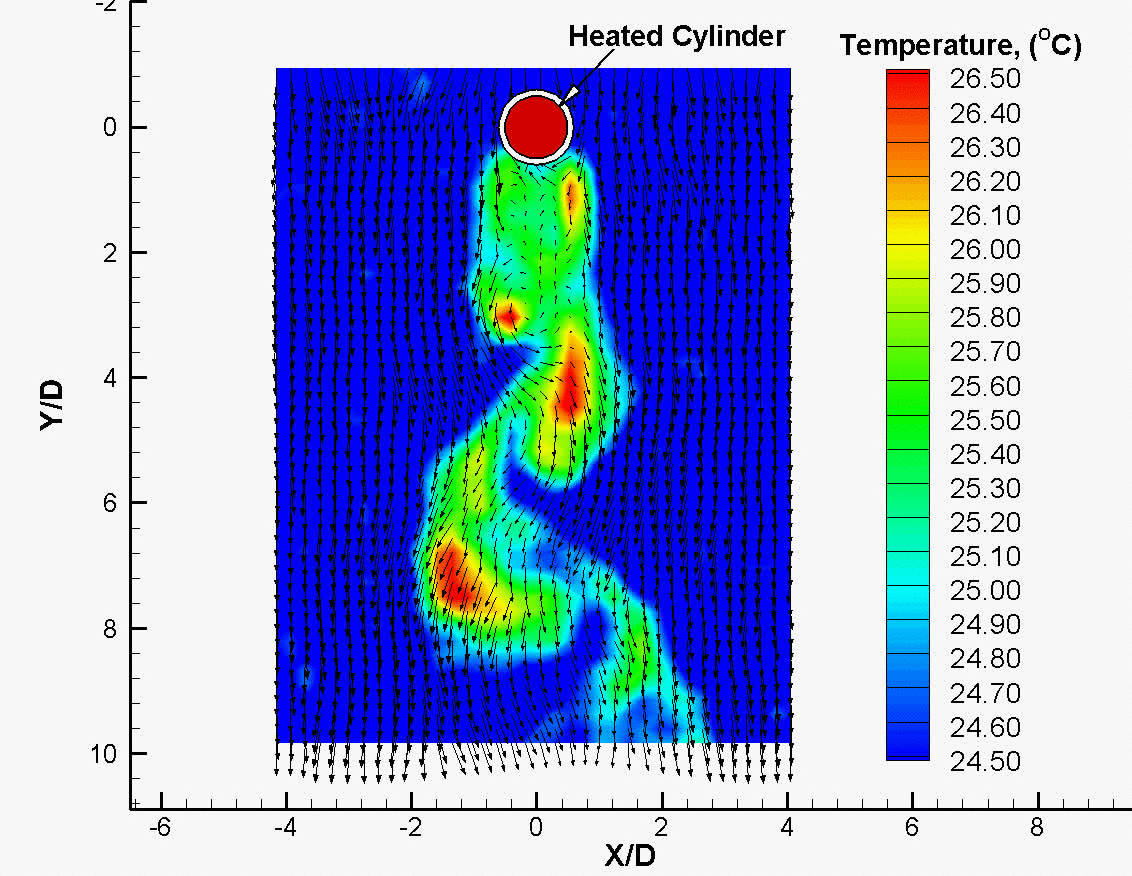
(a). MTT raw image (b). temperature fields derived from the image
Molecular Tagging Thermometry (MTT) with adjustable sensitivity
(a). image of 0.5 ms after the laser pulse
(b). image of 5 ms later
(c). MTV&T results derived from the MTV&T image pair
Molecular Tagging Velocity and Thermometry (MTV&T) measurements
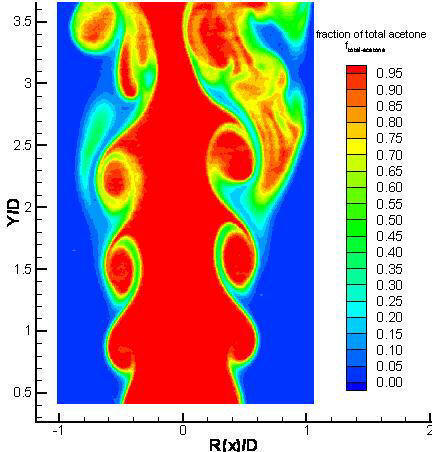
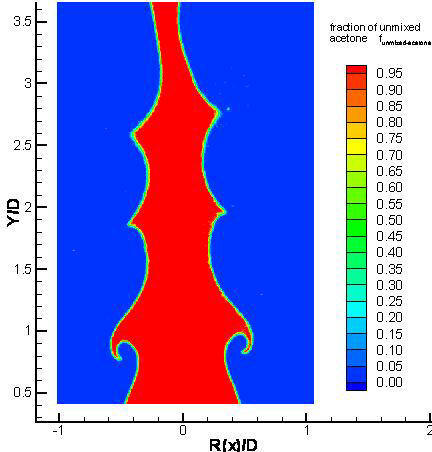
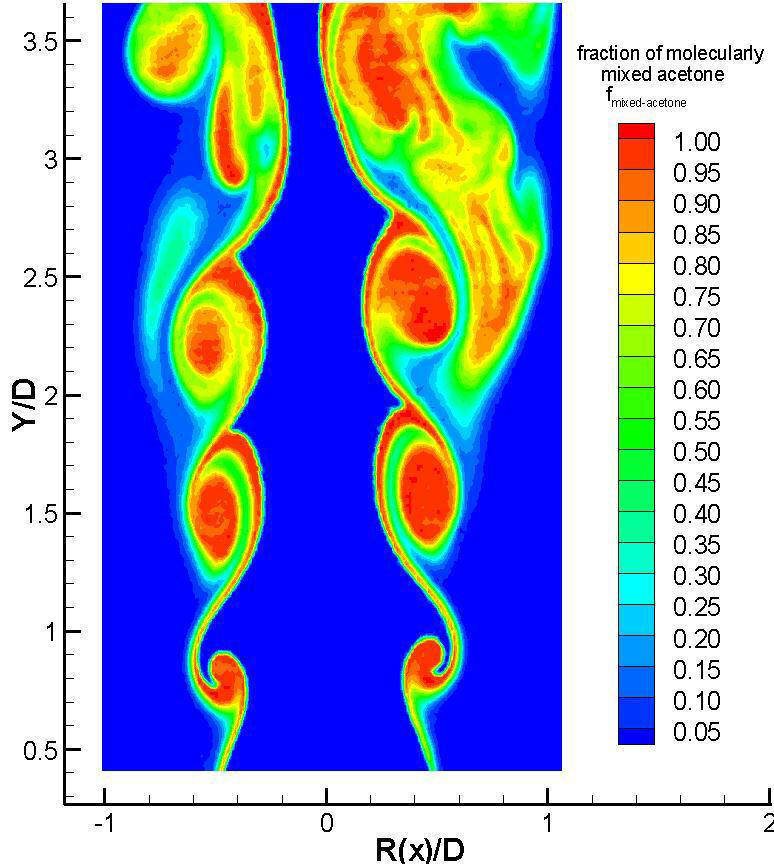
(a). total concentration (b). molecularly-unmixed fraction (c). molecularly-unmixed fraction
Instantaneous quantification of molecular mixing in gaseous jet flow
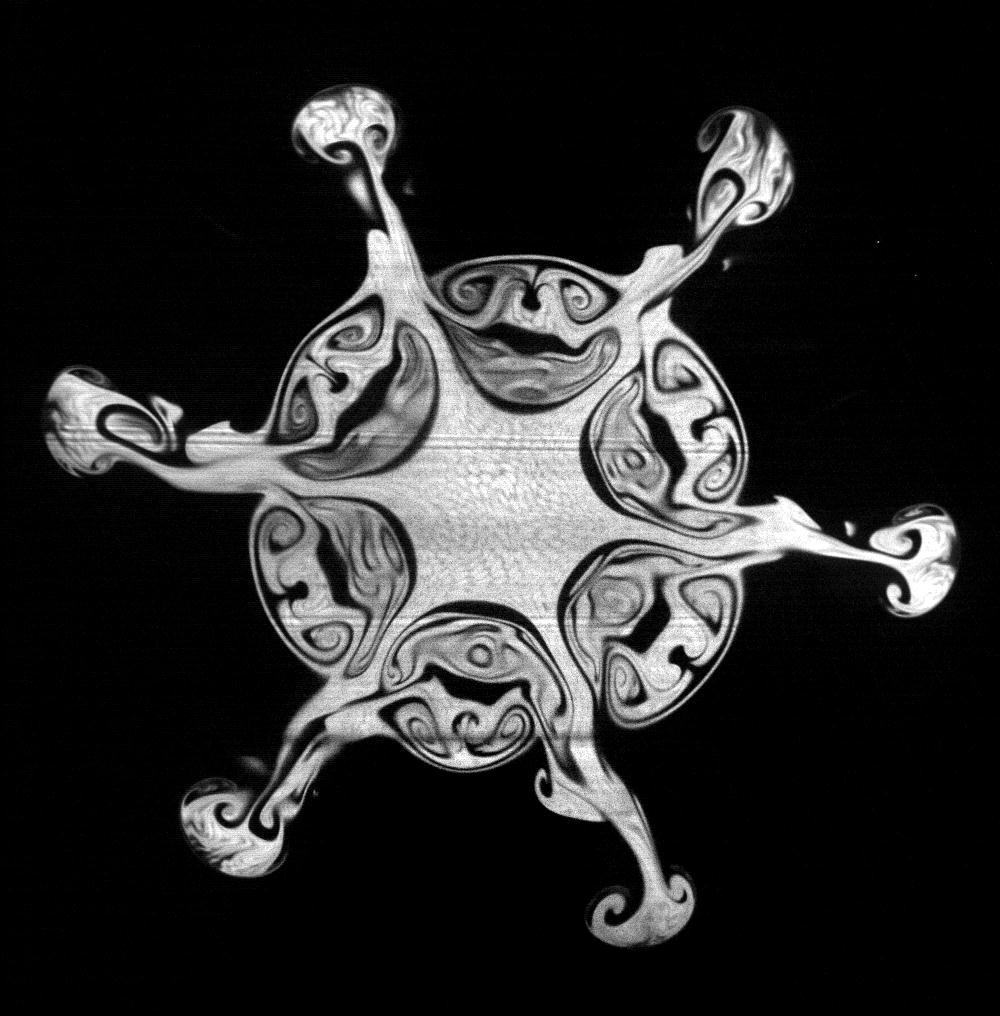
(a). t = t0 (b). t = t0+0.1s
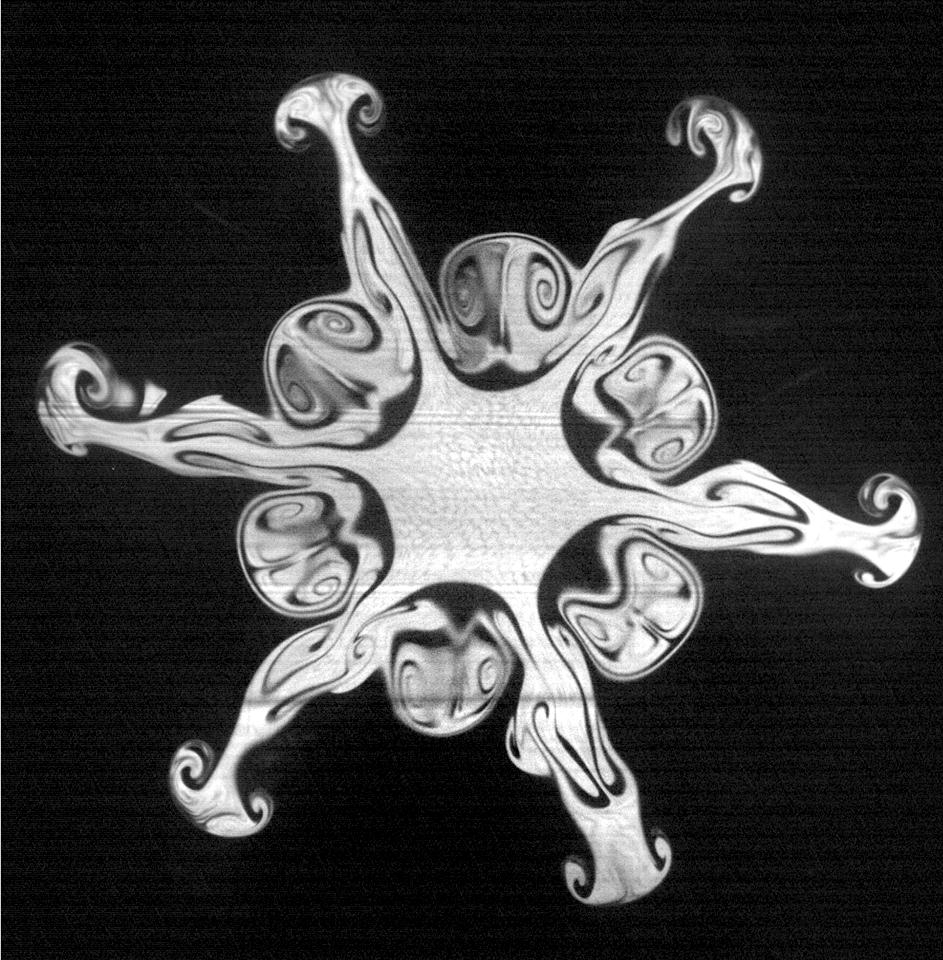
Vortex structures downstream a lobed nozzle/mixer
![]()
![]()
Department of Aerospace Engineering, Iowa State
University, 2271 Howe Hall, Room 1200, Ames, Iowa 50011
Copyright © Iowa State University. All rights reserved.